

Simulation Thermodynamic Methods
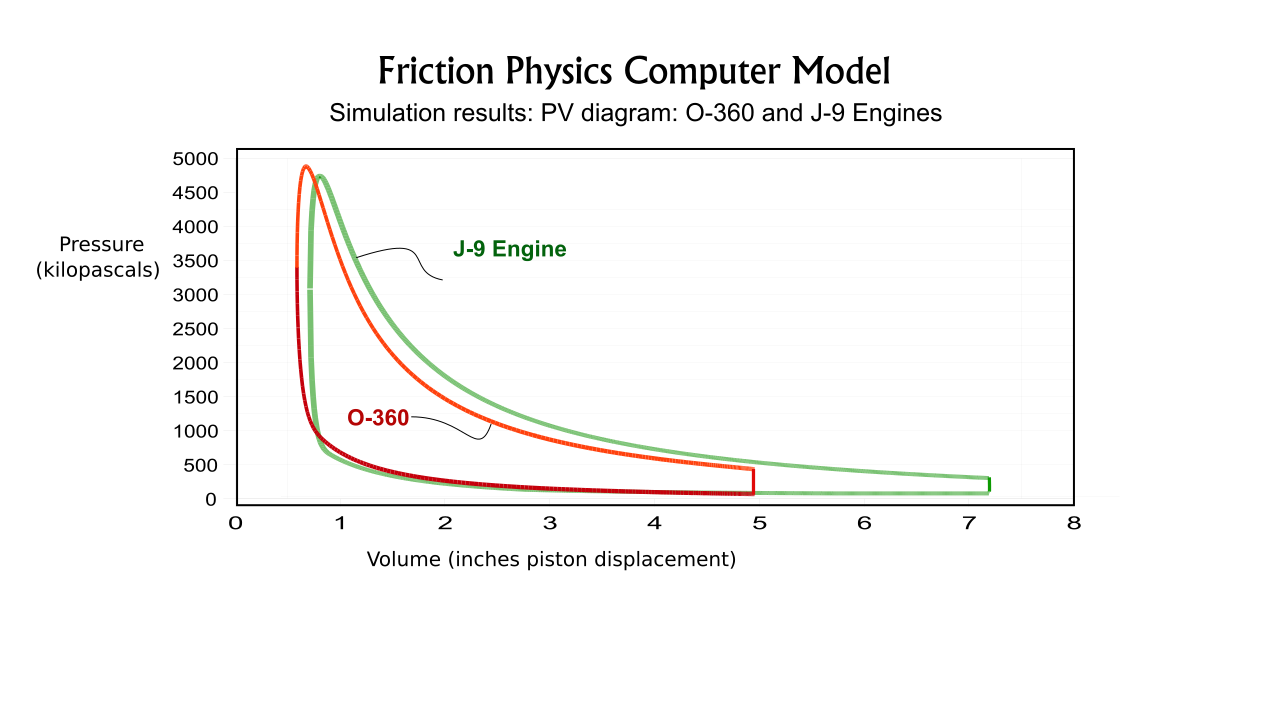
The Friction Physics' computer model divides the engine's piston strokes into small increments. The state of the piston chamber gases is determined after each incremental movement for each piston using thermodynamic equations. Importantly, the loss of heat energy through the chamber walls is calculated for each increment. (Heat loss is not included in basic engine cycle analyses using entropy charts.) The simulation was used to model a prominent aircraft engine for which ample performance data is available, and which has the same piston diameter as the J-Drive Model J9. After testing and proofing the simulation for this known engine the simulation was then used to determine the performance data for the Model J9.
Details of the Friction Physics' computer modeling are disclosed on this webpage.
Comparable Methods
An Analysis of the Lycoming O-320 Engine
Basic thermodynamic methods were used by Justin L. Highly to predict the power curves for a Lycoming O-320 aircraft engine.[1] The O-320 is a predecessor of the model O-360 that is used for validating the Friction Physics simulation, and the two engines have the same comfiguration. Highley's excellent paper is a good and readable description of standard methods for analyzing engine performance.
Limitations of Basic Thermodynamic Methods
Highley found that the standard thermodynamic model predicted significantly higher than actual power output for the O-320 engine. An explanation of this varation is to be found in MIT professor John B. Heywood's seminal textbook: "Internal Combustion Engine Fundamentals."[2] Heywood lists the following processes that are not accounted for in the basic model, and which significantly reduce engine power (paraphrased):
- Losses not included in basic models, in order of importance -
- Heat transfer from burned gas mixture to cylinder walls.
- Duration of combustion process.
(combustion is not instant) - Exhaust Blowdown Loss.
(exhaust valve opens before BDC) - Crevice effects and leakage.
- Incomplete Combustion.
(100% of fuel is not burned in combustion chamber)
1) Heat Transfer Modeling
Heat Transfer Model Components
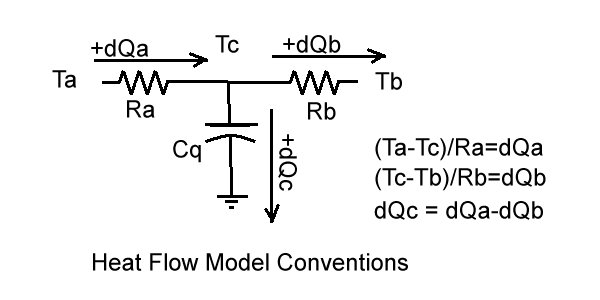
In the modelling Cq is the thermal inertia of the cylinder. Ra is the thermal resistance to heat flow from the chamber gasses into the cylinder, Rb is the thermal resistance to heat flow to the ambient (through cooling fins, mainly). The sum Ra+Rb determines the average overall heat flow. The ratio of Ra to Rb determines several parameters, including the wall depth at which temperature Tq is simulated. The ratio was chosen so that Tq tracks cylinder head temperature.The value of Ra is inversely proportional to the surface area in contact with the cylinder gasses. Because this surface area increases during the piston expansion stroke, Ra decreases during the stroke. Therefore heat flow Qa remains roughly constant during the expansion stroke even though the combustion gas temperature is decreasing. In contrast to Ra, Rb is a constant value because the outer surface contact with ambient air is constant.
Simulation Iterations
The simulation divides piston strokes into small increments. The time duration of each increment is used to calculate the differential heat flows dQa, dQb and dQc at each position of the piston during the compression and expansion strokes, and for the intake and exhaust strokes of the 4-stroke O-360.2) Combustion Modeling
Wiebe Formula
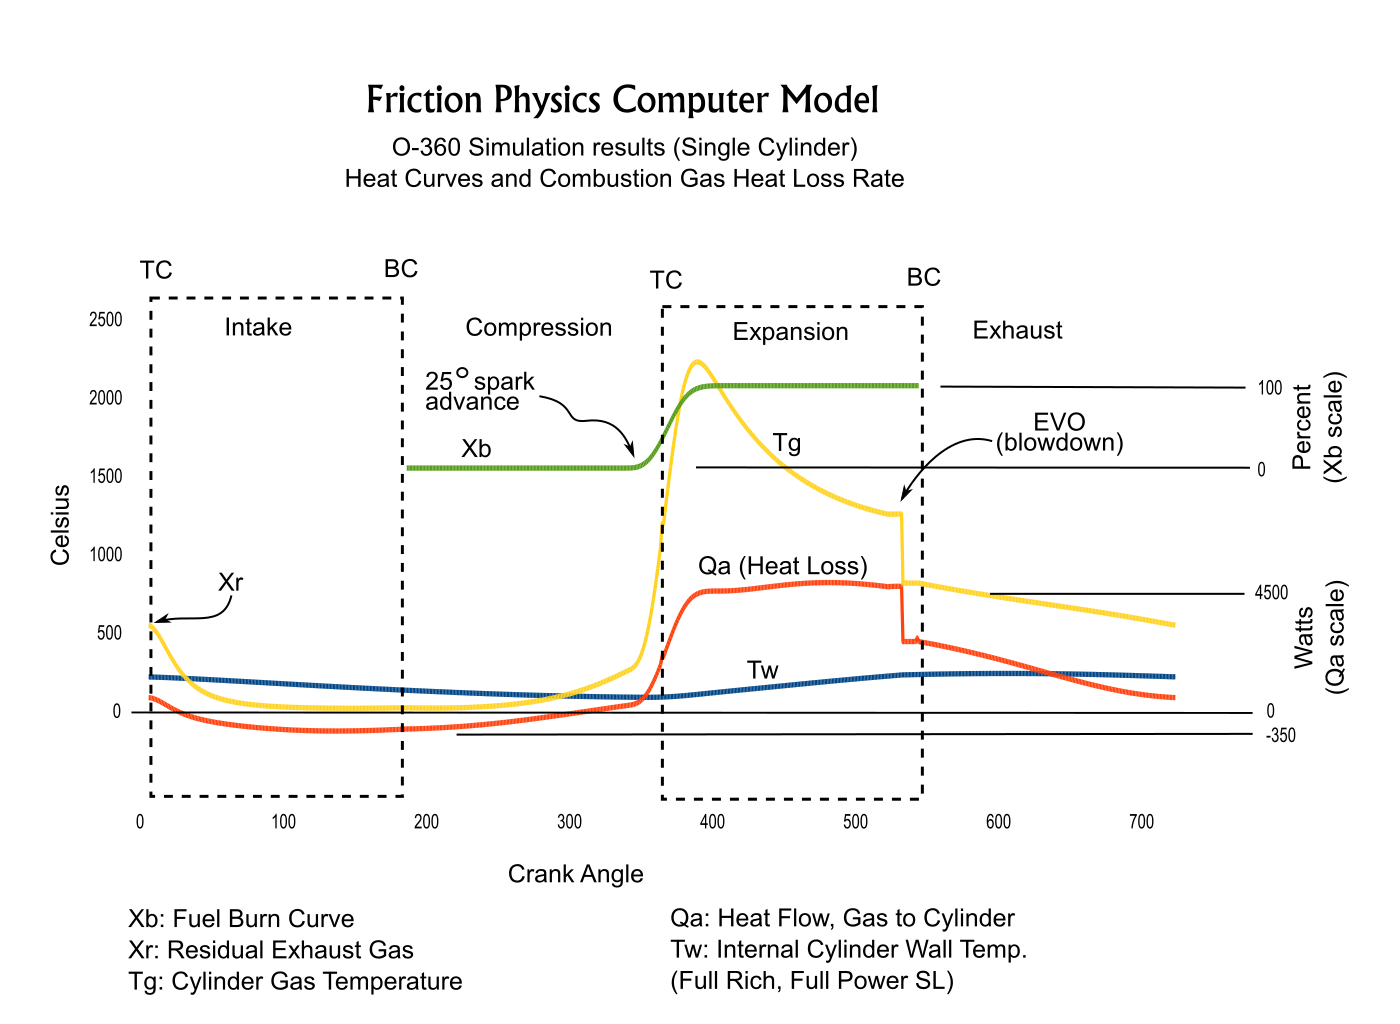
The Weibe function is used in the simulations to produce a realistic fuel burn rate. [5] A printout of the O-360 simulation's burn rate is shown below.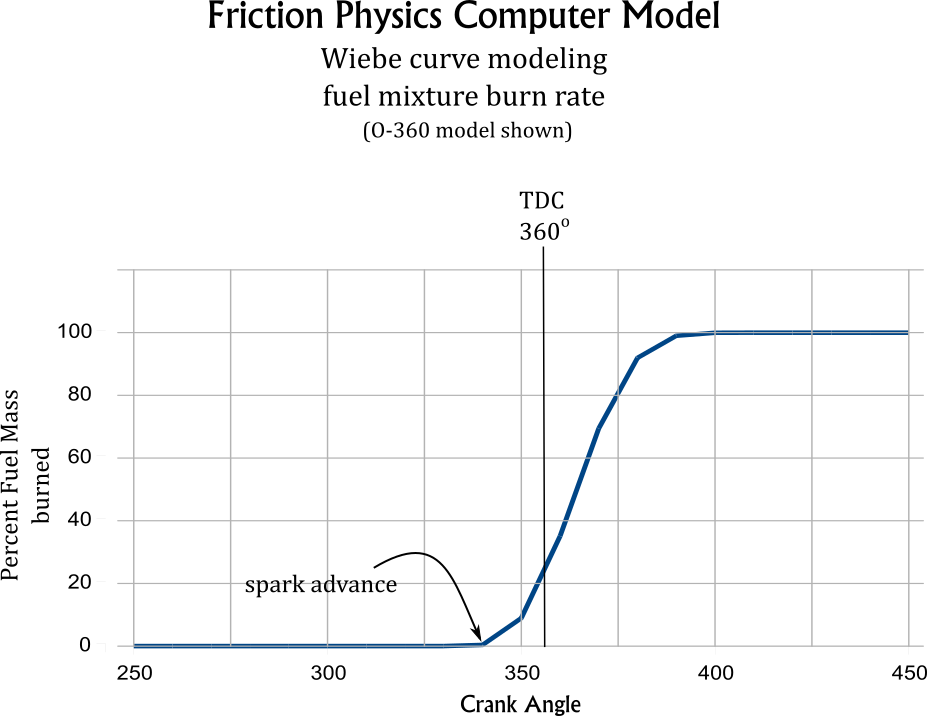
3) Exhaust Blow Down
The computer model simulates exhaust blow-down by decreasing pressure and temperature of the combustion chamber gasses when the exhaust valve opens (EVO). The temperature drop formula used is:| T5 = T4(P5 / P4)^( (Ɣ-1)/Ɣ) ) | |
5) Modeling Incomplete Combustion
Number 5) in Heywood's list is also adressed in the Friction Physics' simulations:Rich Mixtures
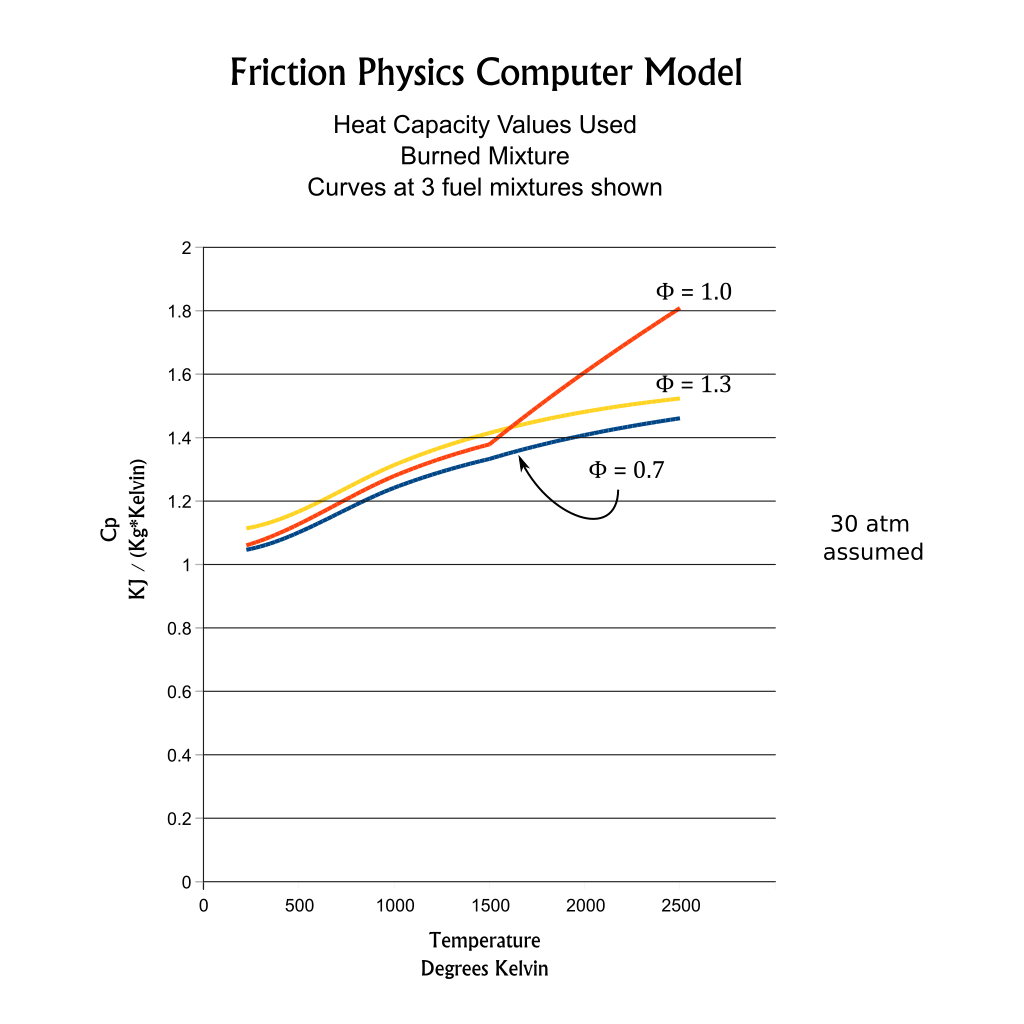
Standard aircraft engines are run at an excessively rich fuel air mixture at full power, leaving a substantial mass of unburned fuel in the burned gas mixture. Heat breaks down this unburned fuel into excess hydrogen and carbon monoxide, and significantly changes the chemistry of the exhaust gas. The simulation calculates the chemistry of the the burned mixture based on the air-fuel ratio, and calculates the heat capacities of the mixture based on this chemistry.Lean Mixtures
Even at lean fuel mixtures 100% combustion is never achieved, but 90% to 99% combustion is usually acheived. 97% combustion efficiency is used in the Friction Physics' simulations. The main effect is a 3% increase in the engine's gal/hr fuel consumption rate, compared to the figure based on 100% combustion efficiency. The effect of unburned fuel on the mixture chemistry is slight, but is still included in the simulations.Gas Composition and Heat Capacities
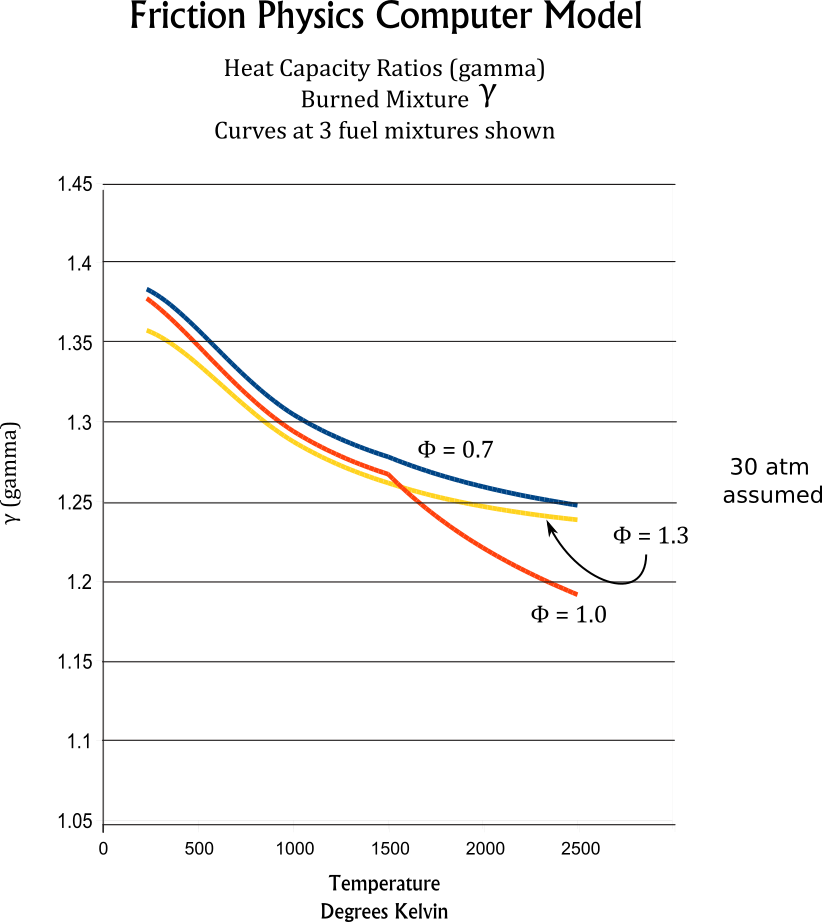
Chemical Dissociation
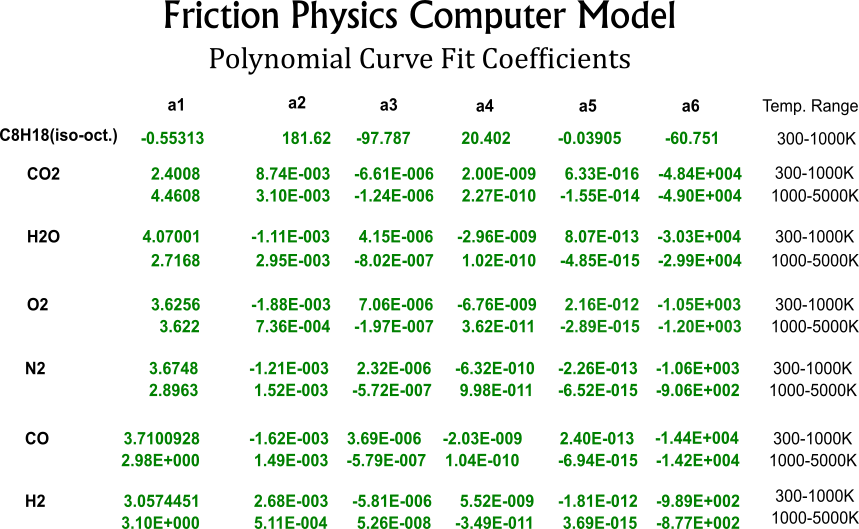
At high temperatures dissociation processes absorb energy and effect gas mixture heat capacities, especially near stoichiometric fuel mixtures. The polynomial curve fits for Gamma and heat capacities are adjusted to model the dissociation process at high temperatures. At the sample curves shown at the right, the divergence of Cp and Gamma curves for ϕ=1 show this adjustment.Because the J-Drive engine models are designed to operate at very lean fuel mixtures,with ϕ = 0.5 to ϕ = 0.7, dissociative processes have minimal effect of engine power production.
| [1] Justin L. Highley: "A Thermodynamic Based Model For Predicting Piston Engine Performance For Use in Aviation Vehicle Design" (pdf) | [4] Ryder, E. A. (1950), SAE Quart. Trans., as sited by Ferguson and Kirkpatrick, see ref [3]. | |
| [2] Heywood, John B., "Internal Combustion Engine Fundamentals", Publisher: McGraw Hill; ISBN: 978-1-25-900207-6; See end of Chapter 5: "Ideal Models of Engine Cycles", Pages 194-195. | [5] See Ferguson, Colin R. and Kirkpatrick, Allan T., "Internal Combustion Engines", page 39 | |
| [3] Ferguson, Colin R. and Kirkpatrick, Allan T., "Internal Combustion Engines, Applied Thermosciences"; Publisher: Wiley; ISBN 978-81-265-3007-6; Chapter 8: "Heat Transfer Modeling", page 231. |